Catalog
-
Catalog
- Antiquitäten & Kunst
- Auto & Motorrad: Fahrzeuge
- Baby
- Business & Industry
- Bücher
- Camping & Outdoor
- Feinschmecker
- Garten & Terrasse
- Haushalt & Wohnen
- Haustierbedarf
- Heimwerken & Garten
- HiFi & Audio
- Home, Construction, Renovation
- Household appliances
- Kleidung & Accessoires
- Modellbau
- Musik
- PC- & Videospiele
- Photo & camcorders
- Sammeln & Seltenes
- Spielzeug
- TV, Video, DVD
- Telekommunikation
- Uhren & Schmuck
- Wellness & Beauty
- computers & electronics
- entertainment & hobby
- fashion & lifestyle
- food, beverages & tobacco
- garden & patio
- health & beauty
- institutional food services equipment
- medical equipment, accessories & supplies
- office
- sports & recreation
- vehicles & accessories
- weapons & ammunition
Filters
Search

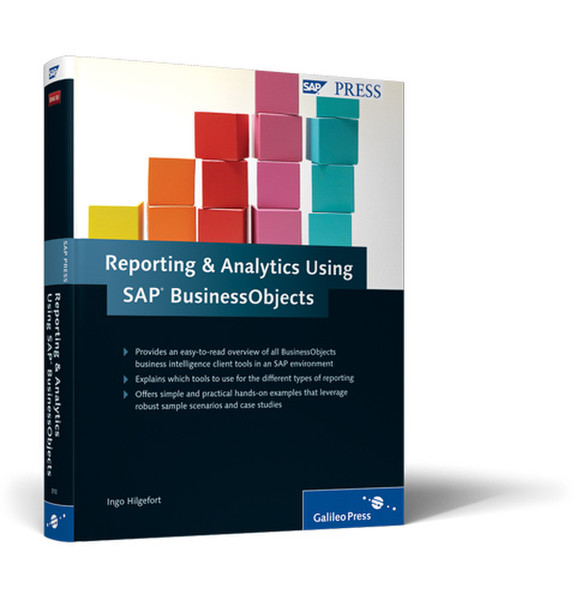
SAP Reporting and Analytics using BusinessObjects 648pages software manual
EAN: 9781592293100
MPN: 978-1-59229-310-0
🚚 Select the country of delivery:
Delivery from:
Germany
Sale and delivery by:
Where to buy and prices (Advertising *)
On Top
Technical specifications
On Top
Technical details
| Number of pages | 648 pages |
|---|---|
| Written by | Ingo Hilgefort |
Reporting and Analytics using SAP BusinessObjects
One of the most valuable resources a company has (and often the most misused or under-used) is the massive amount of company data sitting in a database, including everything from sales figures and shipping expenses, to other key performance indicators and metrics. By using the SAP BusinessObjects suite of business intelligence (BI) tools, companies have the power to transform their data into a powerful strategic and tactical tool to manage and grow their businesses. This book provides a comprehensive overview of the reporting, analysis, and visualization tools available from SAP BusinessObjects.
Introduction to all the SAP BusinessObjects Reporting and Analytics Tools
Learn about the various tools, the different users of each tool, and the major functions for each of the tools.
Enterprise Reporting with Crystal Reports
Explore pixel perfect reporting with Crystal Reports and understand who this powerful tool is for and what it can do.
Ad Hoc Reporting and Queries with Web Intelligence
Discover how to enable users to create queries from scratch, format retrieved information, and easily analyze underlying trends and root causes.
Integrating into Microsoft with Live Office
Find out how to leverage content from your BusinessObjects Enterprise system in Microsoft® Excel, Word, PowerPoint, and Outlook.
Creating Dashboards and Visualizations with Xcelsius
Discover how to present complex business data clearly and provide decision makers the ability to interact with the information and manage their businesses proactively.
Highlights
- Enterprise Reporting
- Ad-Hoc Query and Analysis
- Advance Analysis
- Dashboarding and Data Visualizations
-
Payment Methods
We accept:


