Catalog
-
Catalog
- Antiquitäten & Kunst
- Auto & Motorrad: Fahrzeuge
- Baby
- Business & Industry
- Bücher
- Camping & Outdoor
- Feinschmecker
- Garten & Terrasse
- Haushalt & Wohnen
- Haustierbedarf
- Heimwerken & Garten
- HiFi & Audio
- Home, Construction, Renovation
- Household appliances
- Kleidung & Accessoires
- Modellbau
- Musik
- PC- & Videospiele
- Photo & camcorders
- Sammeln & Seltenes
- Spielzeug
- TV, Video, DVD
- Telekommunikation
- Uhren & Schmuck
- Wellness & Beauty
- computers & electronics
- entertainment & hobby
- fashion & lifestyle
- food, beverages & tobacco
- garden & patio
- health & beauty
- institutional food services equipment
- medical equipment, accessories & supplies
- office
- sports & recreation
- vehicles & accessories
- weapons & ammunition
Filters
Search

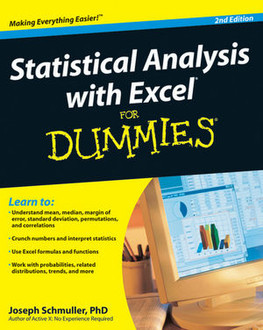
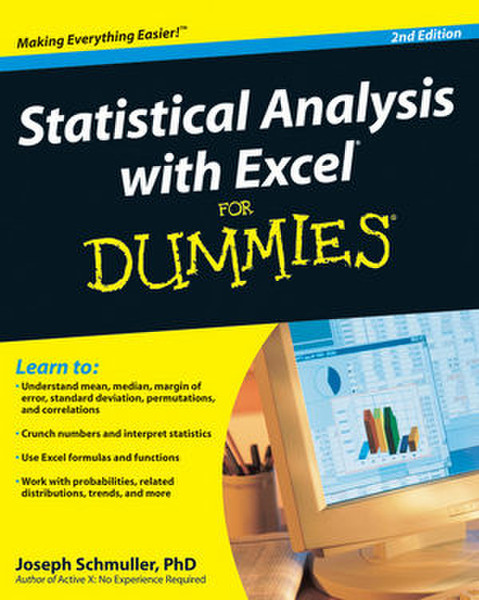
Wiley Statistical Analysis with Excel For Dummies, 2nd Edition 504pages software manual
EAN: 9780470454060
MPN: 978-0-470-45406-0
🚚 Select the country of delivery:
Delivery from:
Germany
Sale and delivery by:
Where to buy and prices (Advertising *)
On Top
Technical specifications
On Top
Technical details
| Genre | Office software |
|---|---|
| Number of pages | 504 pages |
| Written by | Joseph Schmuller, Ph.D. |
Additionally
| Release date | 05/2009 |
|---|
Statistical Analysis with Excel For Dummies, 2nd Edition
You too can understand the statistics of life, even if you're math-challenged!
What do you need to calculate? Manufacturing output? A curve for test scores? Sports stats? You and Excel can do it, and this non-intimidating guide shows you how. It demystifies the different types of statistics, how Excel functions and formulas work, the meaning of means and medians, how to interpret your figures, and more — in plain English.
- Getting there — learn how variables, samples, and probability are used to get the information you want
- Excel tricks — find out what's built into the program to help you work with Excel formulas
- Playing with worksheets — get acquainted with the worksheet functions for each step
- Graphic displays — present your data as pie graphs, bar graphs, line graphs, or scatter plots
- What's normal? — understand normal distribution and probability
- Hyping hypotheses — learn to use hypothesis testing with means and variables
- When regression is progress — discover when and how to use regression for forecasting
- What are the odds — work with probability, random variables, and binomial distribution
Open the book and find:
- Ten statistical and graphical tips and traps
- The difference between descriptive and inferential statistics
- Why graphs are good
- How to measure variations
- What standard scores are and why they're used
- When to use two-sample hypothesis testing
- How to use correlations
- Different ways of working with probability
-
Payment Methods
We accept:


